Illustrative case: Building materials dealer, Limburg · 2026
From twelve spreadsheets to one management dashboard
Every morning at seven, yesterday’s numbers, without anyone lifting a finger.
Results
Indicative figures
- 12 → 1Excel files replaced by 1 dashboard
- −1 daymanual reporting work per week
- 07:00yesterday’s numbers available, every day
- 10 wksfrom kickoff to rollout
The story
The story behind From twelve spreadsheets to one management dashboard
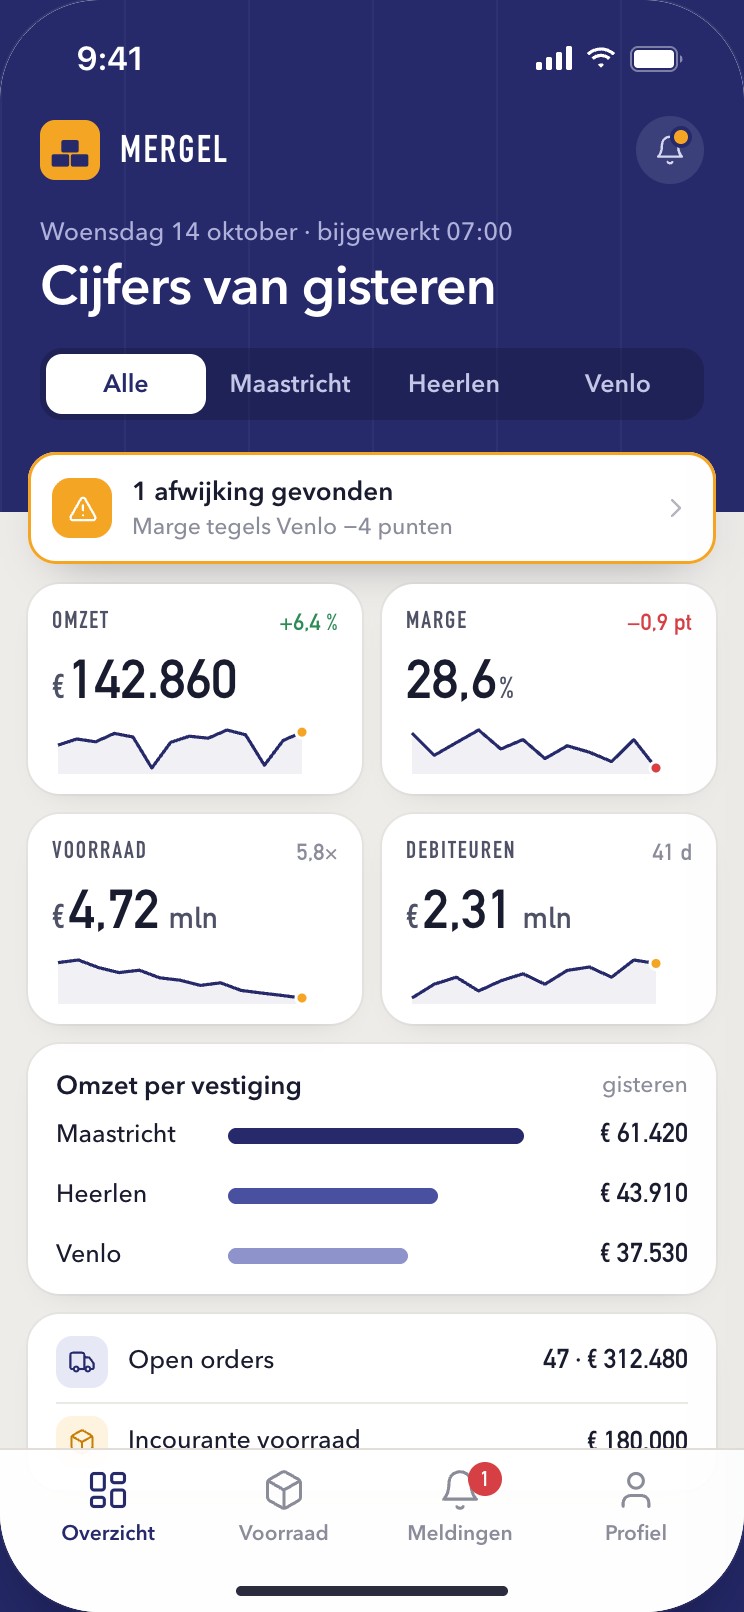
Three branches, 14,000 products and a controller who stitched together twelve Excel files every Monday. We built a warehouse-light on AFAS, Exact Online and the POS system and one dashboard with revenue, margin, stock and receivables per branch, updated automatically every morning.
The challenge
Management received numbers a week late, from reports built by one person in Excel. Margin per product group was an estimate, dead stock was spotted too late and the branch managers each had their own truth.
The sources were scattered: finance in AFAS, purchasing in Exact Online, sales in a POS system without a reporting module and pricing agreements in an Access database.
Our approach
We started with KPI definitions: what is margin, when is stock dead, which revenue counts for which branch. Then we built a warehouse-light in PostgreSQL with daily pipelines from AFAS (GetConnector), Exact Online and a POS export, with data quality checks that flag deviations.
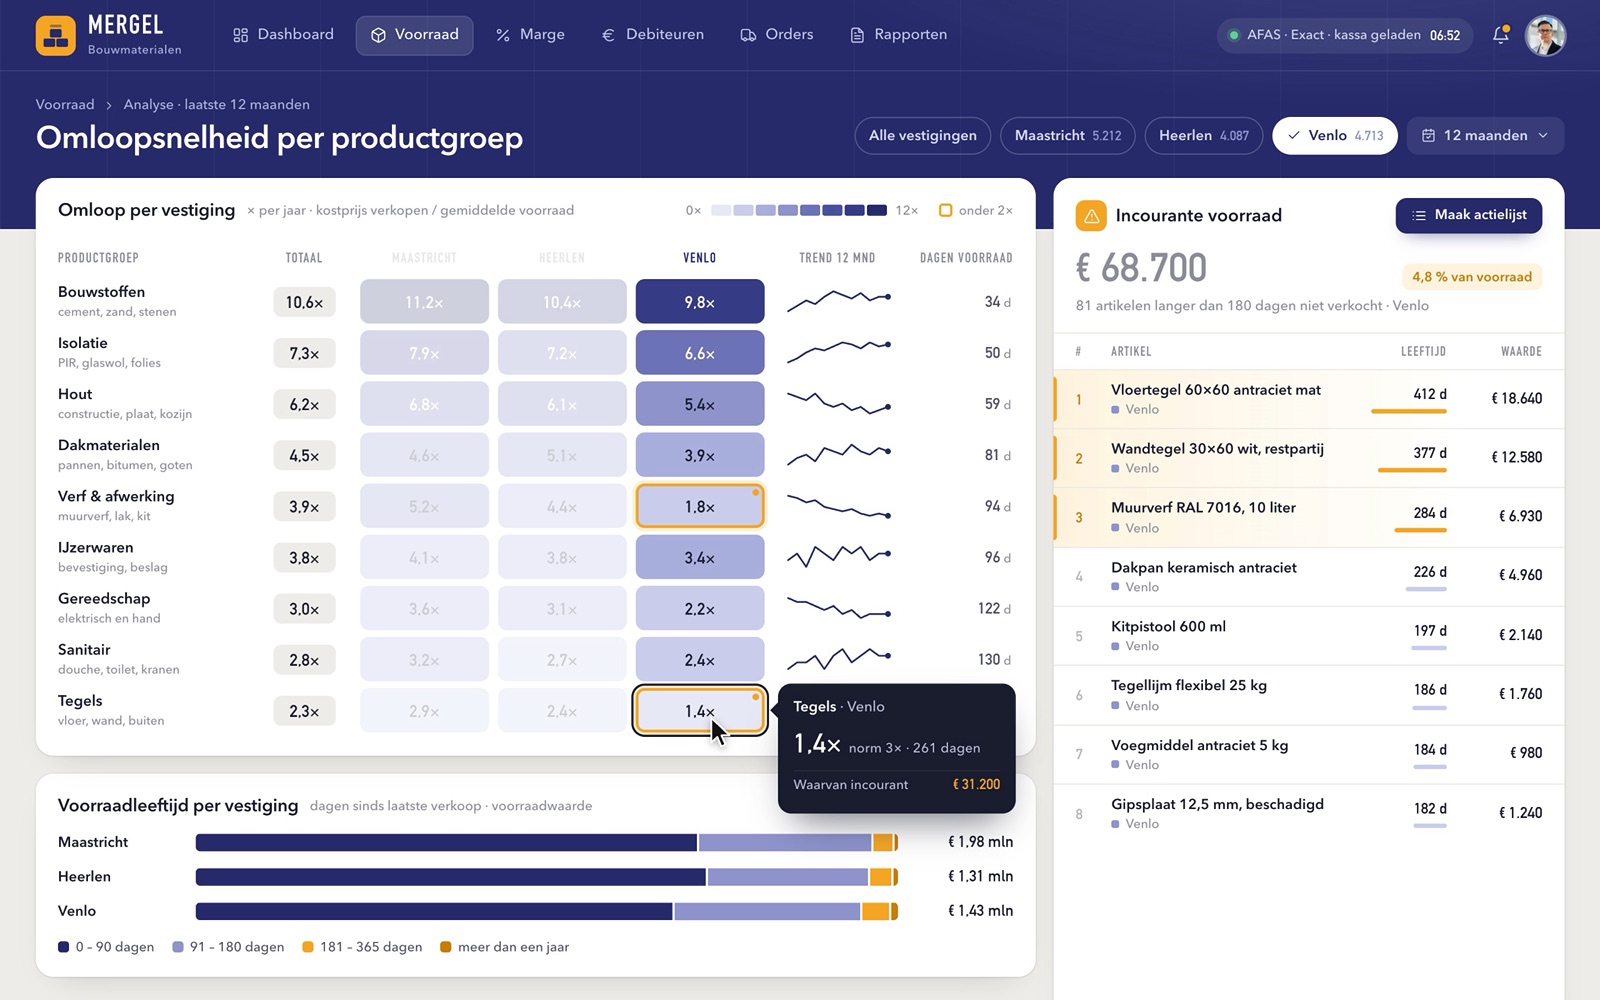
On top of the warehouse we built Power BI dashboards for management, the controller and branch managers, with roles and permissions. Two review rounds with the users determined which numbers belong on the first screen.
Ten weeks from kickoff to full rollout, with a four-week parallel period alongside the old Excel reports to validate the numbers.
The solution
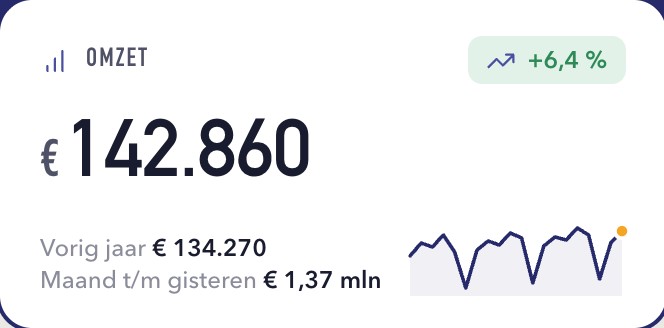
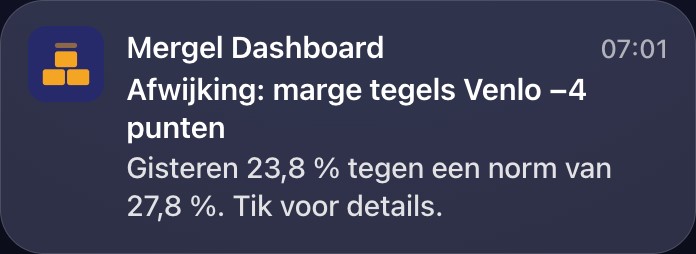
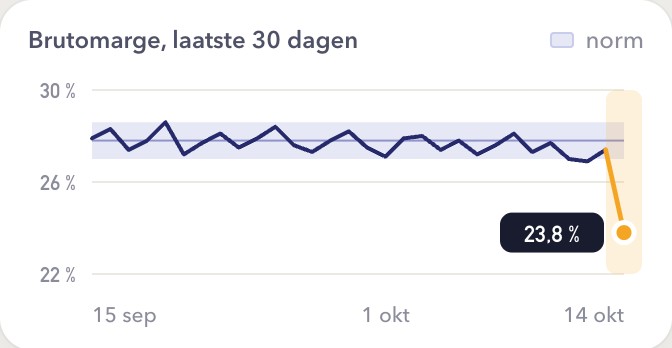
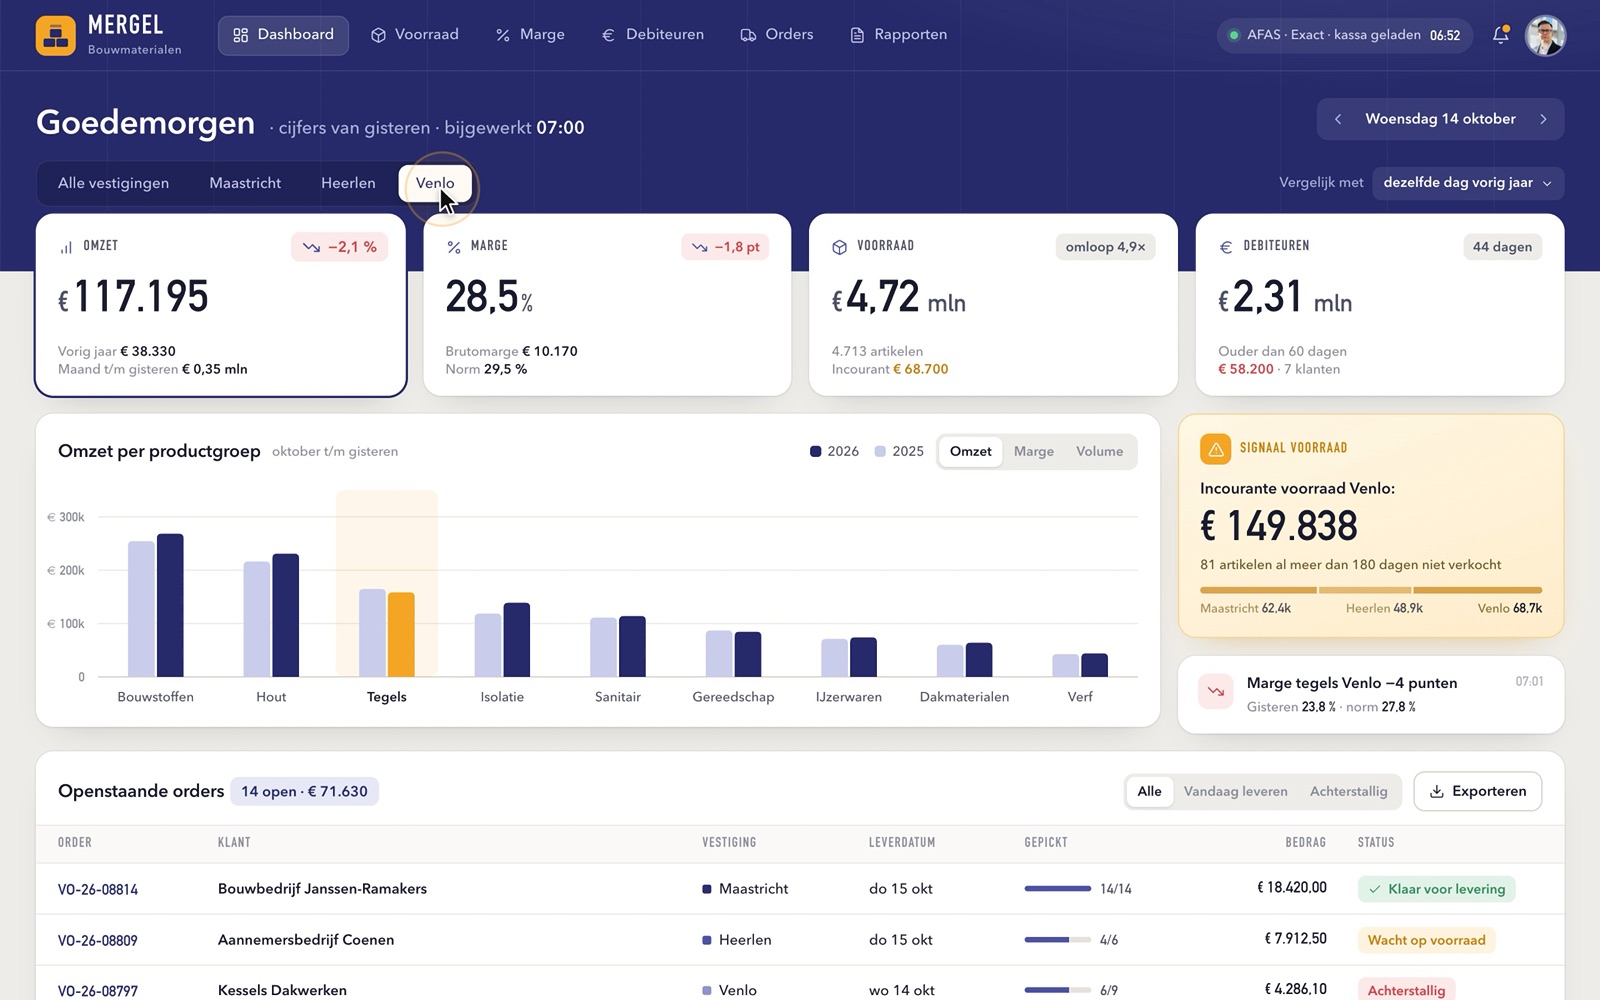
One dashboard with revenue, margin, stock rotation, dead stock, receivables and open orders per branch and product group, updated every morning at 07:00. Alerts on deviations. The controller spends the freed day on analysis instead of copy-paste.
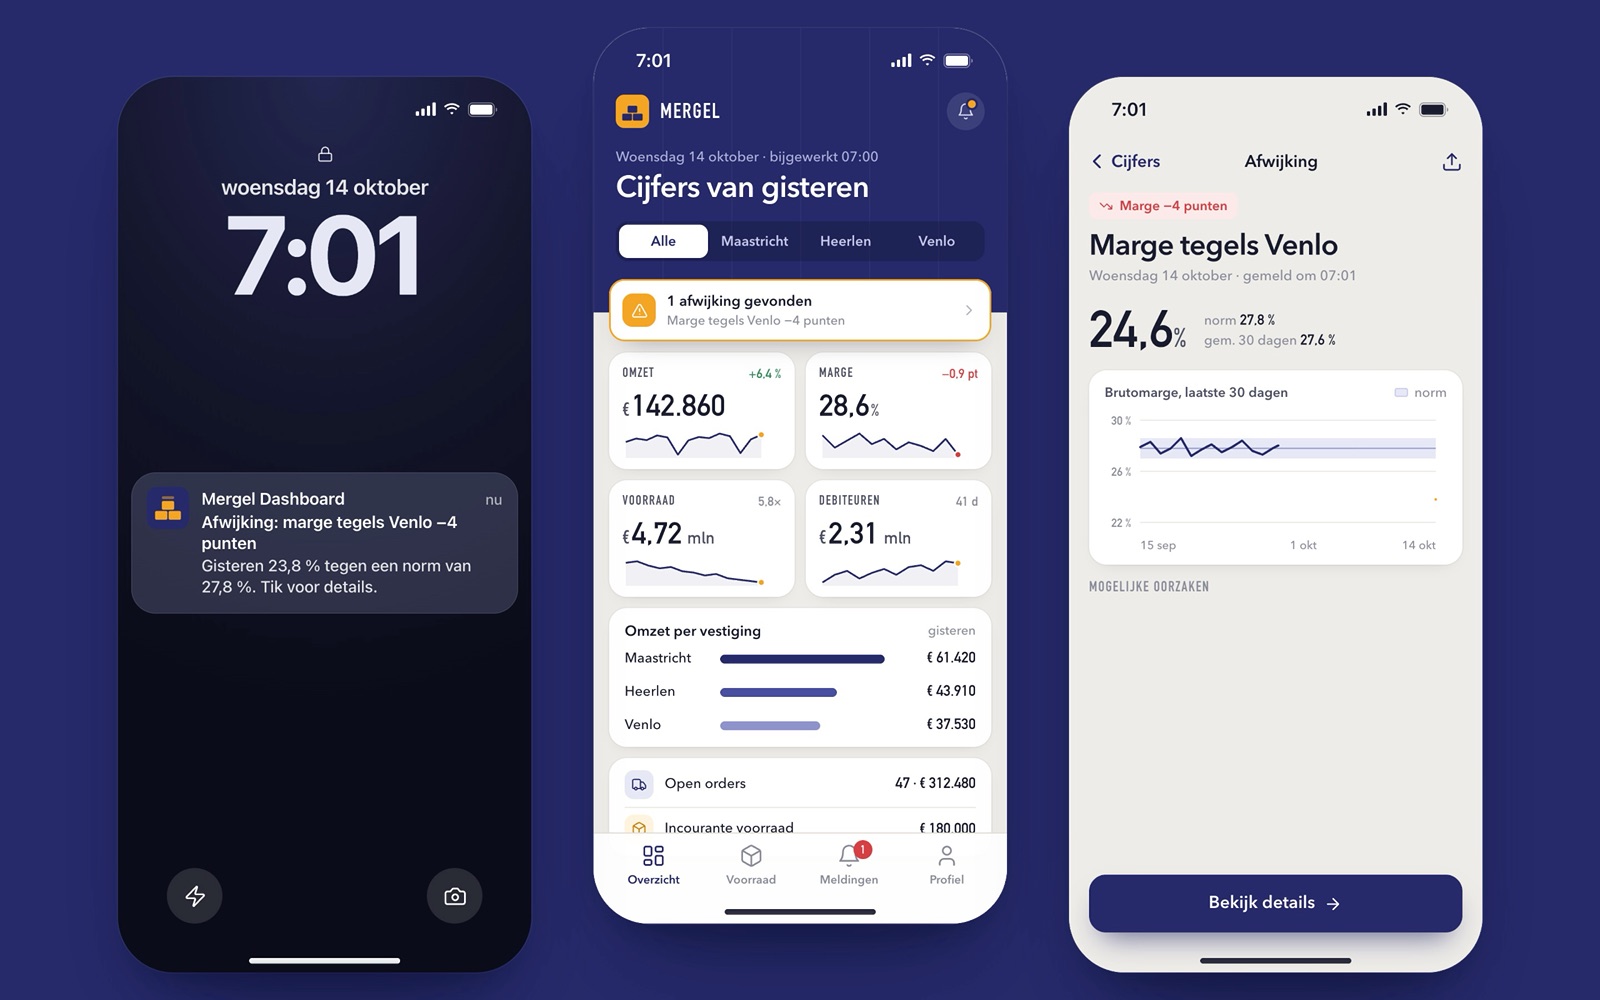
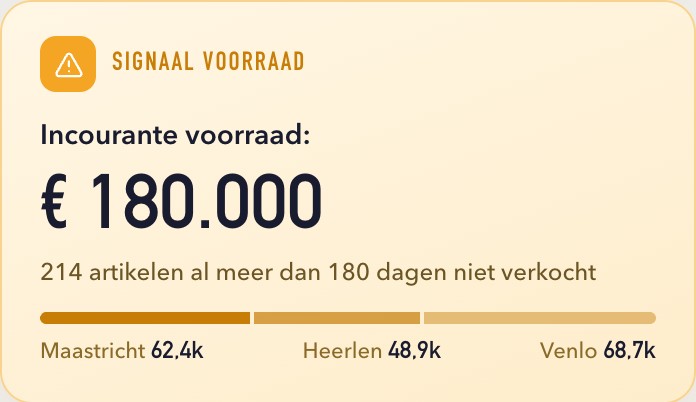
Within one quarter the dashboard identified €180,000 of dead stock that was subsequently reduced.
 Watch it in action0:21 · 3 scenes
Project facts
About this project
- Client
- Building materials dealer, Limburg
- Industry
- Construction & installation
- Year
- 2026
Delivered
- KPI definitions
- Warehouse-light on PostgreSQL
- Pipelines from AFAS, Exact and POS
- Data quality checks and alerts
- Power BI dashboards with roles
- Training
- BI plan
Technology
- Power BI
- PostgreSQL
- Node.js
- AFAS GetConnector
- Exact Online API
- dbt
- Azure (EU)
- Grafana
Illustrative case: composed from comparable engagements. Figures are indicative, not the measured result of one client.
More work
More work
-
Web applications & platforms Transport company, Rotterdam
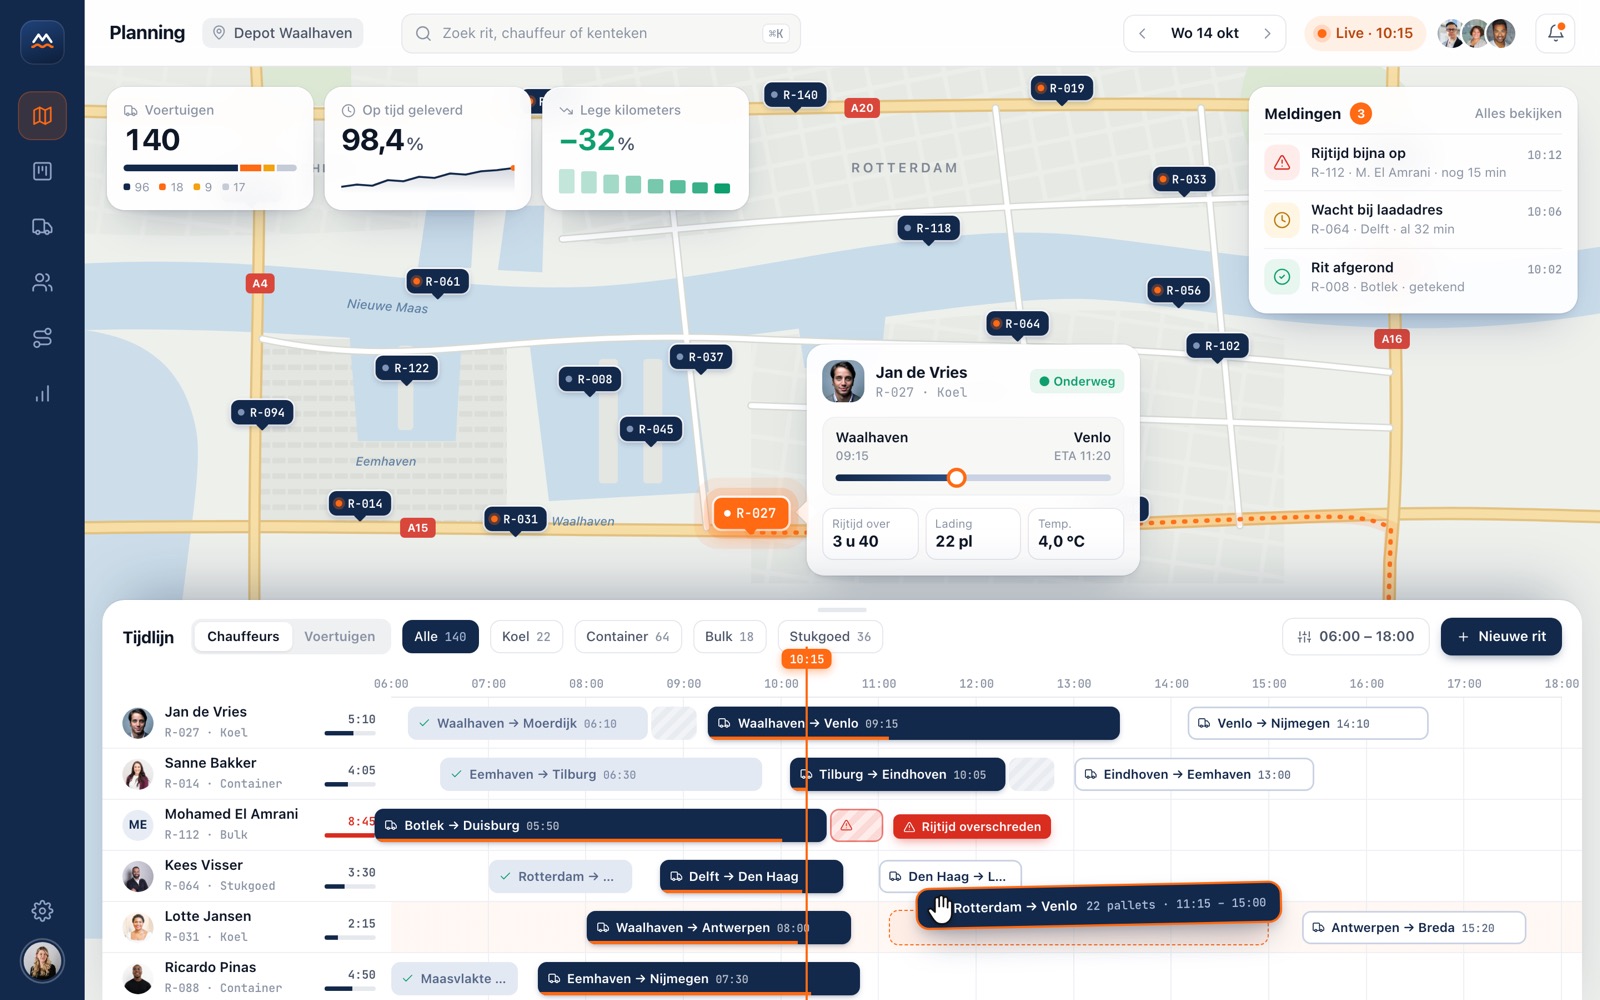
Real-time planning platform for 140 vehicles
−32% empty kilometers -
Web applications & platforms Restaurant group (6 locations), Utrecht
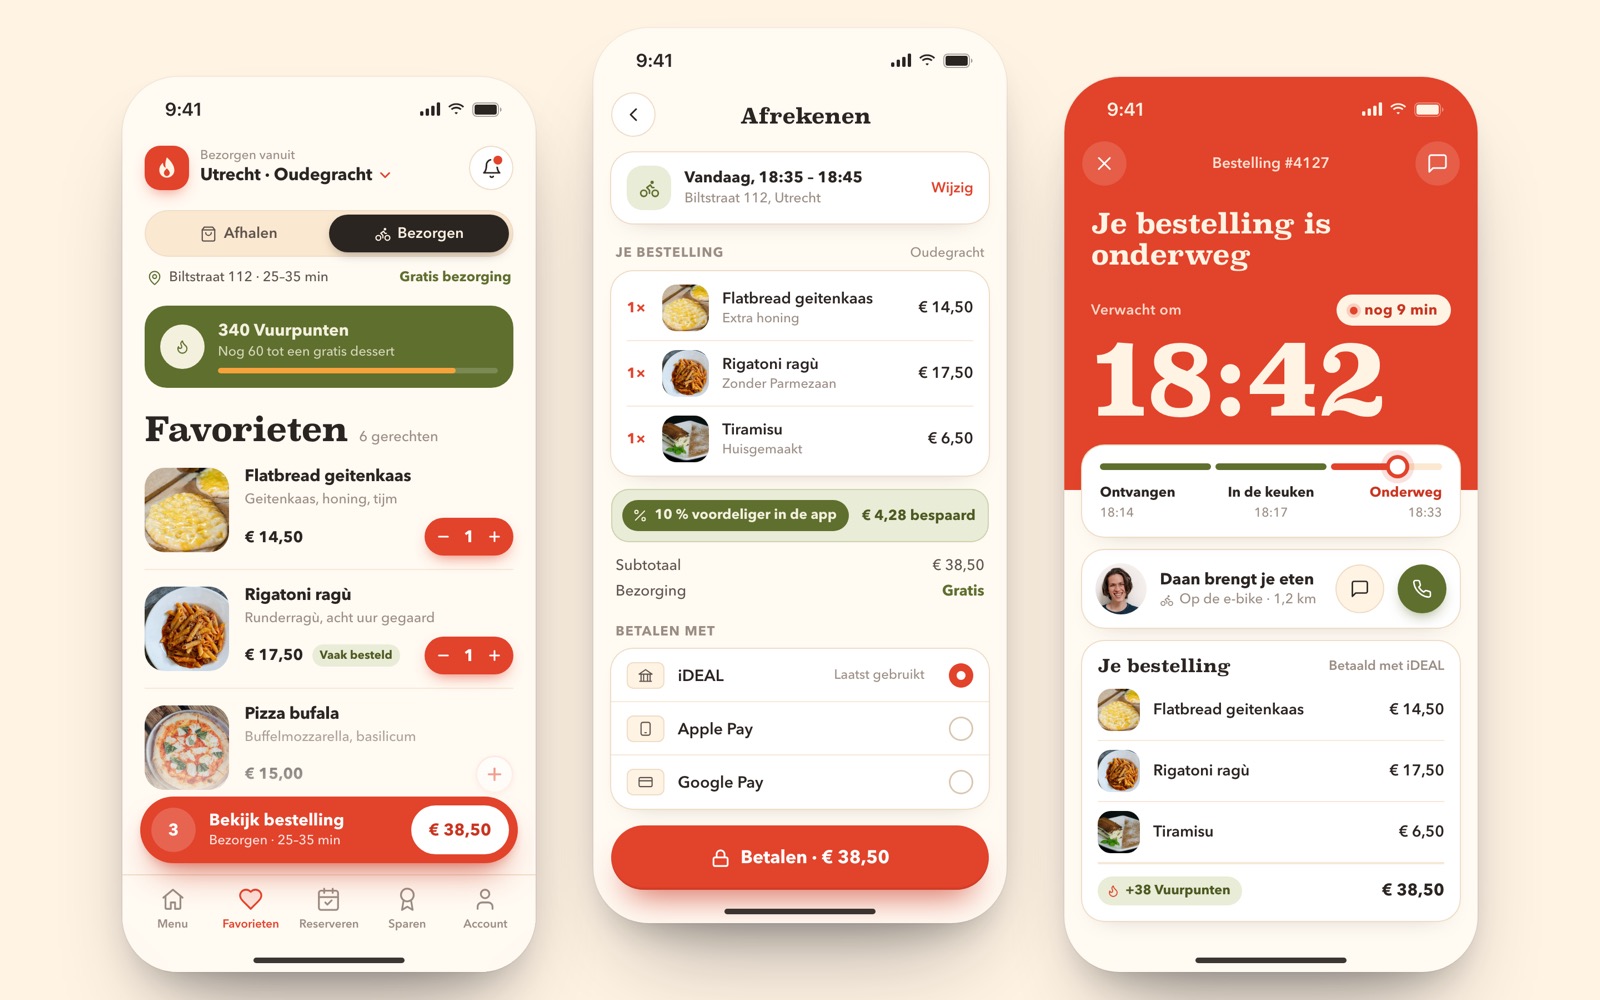
Commission-free ordering and reservation platform
0% commission on owned orders -
E-commerce & online stores D2C fashion label, Netherlands

Headless store with 0.8 s LCP and +28% conversion
0.8 s LCP on mobile (was 3.1 s)
Let’s build something.
Tell us about your project. You will hear back within one business day and receive a concrete proposal within a week.